OK, so as a middle-aged person, I am supposed to spend my days stealing houses from Millennials, misinterpreting their profound social media posts as self-entitled whining (Dang, got sidetracked onto Millennnials again. Must. Focus.), consuming more than my share, and generally not caring a jot as the planet cooks.
But a chance remark got me thinking: is the Puangiangi restoration project 100% wonderful in every respect, or is it an insidious little contributor to climate disaster dressed up as something else?
I already knew that the single biggest thing an individual can do to halt anthropogenic climate change, is not travel internationally (thank you, SEWTHA) (Ref. 1). It was a pretty short leap to imagine what using chartered helicopters on the island project might be doing, but where does short-haul travel on a 50-seater plane and use of cars, ferries and water taxis come in?
I made a list of things we are doing on the project that might be hurting, and a list of things that might be helping. Then it was a matter of looking at each one and deciding if they were significant, and adding them up.
I figured that it would be best to look at the incremental effects of the project, over and above what I would otherwise be doing with my time. So I’m looking at: the extra travel; the extra resource consumption, beyond just living a normal and hopefully not too impactful life back in town; and on the plus side, considering any CO2 that is being sequestered as a result of the project. If you like, this is by way of a voluntary report based on the guidelines for corporate greenhouse gas reporting published by the Ministry for the Environment (MFE) (Refs 2 and 3). Throughout, I will be referring to CO2-e: Carbon Dioxide equivalents, measured in kg or tonnes of CO2 per unit of activity. So, here goes:
Travel
The project involves about 12 visits a year: 10 by plane from Wellington to Nelson, car to French Pass, charter boat to Puangiangi, and return; and 2 by ferry from Wellington to Picton, car from Picton to Rai (and Peter driving out from Nelson to Rai), then to French Pass, boat, and return. The harshest interpretation is to say that all this travel is incremental. So although, for example, we aren’t using our cars in the city while we are on the island, I’m saying we would be saving up the trips we would otherwise have taken and doing them on our return.
Air New Zealand publishes a calculator (Ref. 4) that says a trip for one passenger on their Wellington-Nelson flight produces 19 kg CO2-e (38 kg for the return trip). I’m taking the following figures for petrol and diesel to work out the car and charter boat side of things: 250 g CO2-e per km driven for a medium car over a windy road (extrapolated from figures in Ref. 3), and diesel consumption of 40 L/hr on the charter boat (one hour one-way) at 2.72 kg CO2-e per litre (Ref. 3). For the ferry, I’m using a published figure for smaller roll on-roll off vessels of 60 g CO2-e per tonne-km (Ref. 5) which, allowing 2 tonnes for the weight of my vehicle, me and freight, and a distance of just under 100 km, gives 12 kg CO2-e for a one-way trip.
This all adds up to a CO2-e of 316 kg for a return trip using the plane, and 352 kg for a return trip involving the ferry (which has extra car travel). That gives an annual travel CO2-e of 3.9 tonnes, with the boat charter constituting nearly 70%. The best thing we could be doing to lower the travel footprint is to try to take charter boat trips when the skipper is using his boat for something else at the same time. When several people are coming from Wellington on a trip, and of course if a lot of freight is being carried, the ferry route would be a good idea.
Helicopters
Sometimes we need to use helicopters, such as for weed spraying on the cliffs, or for moving animals on or off where their welfare requires the less time in boxes the better. I’m guessing about 4 hours of helicopter time a year. A twin-engined Squirrel uses 180 L of avgas an hour (Ref. 6), which makes for a CO2-e of 1.8 tonnes per year.
Living and Working On Site
In looking at the emissions resulting from working on the island, I identified LPG use for cooking and hot water, wood for heating, petrol for scrub bars, chainsaws and the like, solar panels and batteries for power, and we have a fridge. Most of this is incremental usage as our houses back in town are still occupied while we are away.
We use an 18 kg bottle of LPG in about 3 months. At 3.03 kg CO2-e per kg of LPG (Ref. 3), that’s 0.22 tonnes per year. We use about 10 L (7 kg) of petrol every two months. At 2.36 kg CO2-e per kg (Ref. 3), that’s a further 0.10 tonnes per year. We burn perhaps 200 kg of firewood a year, which at the published 0.0795 kg CO2-e per kg (Ref. 3) is only 0.02 tonnes CO2-e. I can’t get my head around the derivation of the firewood numbers.
Standard domestic fridges are held to lose 3% of their refrigerant per year (Ref. 2). Taking the 100 grams of refrigerant to have 2000 times the global warming potential of CO2, that makes for 0.006 tonnes CO2-e per year.
The MFE guidelines for reporting don’t address life cycle analyses, but I also wondered what the effect of the solar power system might be. A solar panel array, the inverter equipment and the aluminium racking are thought to have a footprint of about 500 tonnes of CO2-e per MW of installed capacity (Ref. 7). Our system is 2.28 kW, so over a lifetime of say 15 years and assuming it doesn’t get recycled, that is a burden of 0.08 tonnes per year. The lead-acid batteries are held to have a footprint of 1.14 kg CO2-e per kg (Ref. 8). I think this allows for the lead to be recycled but I’m not sure. For 800 kg of batteries and a ten-year life, that comes to 0.09 tonnes CO2-e per year. Our special situation requires the spent batteries to be flown off for recycling (and new ones on at the same time), and a 1.4-hour helicopter trip once in 10 years will add about 0.06 tonnes CO2-e per year.
These living and project work components add up to 0.6 tonnes CO2-e per year.
In summary, the biggest burdens are travel to and from the project site, and helicopter use on the project. The sum of the identified emissions is 6.3 tonnes CO2-e per year.
Sequestration: Forest Regeneration
What of the offsets inherent in the project that we can use to balance up the emissions side of things? I have used the lookup tables published by the Carbon Farming Group (Refs 9 and 10).
Puangiangi has about 10 Ha of mature coastal broadleaf forests. We could assume that they are now only maintaining themselves rather than actively growing, or at best storing about a tonne per hectare per year.
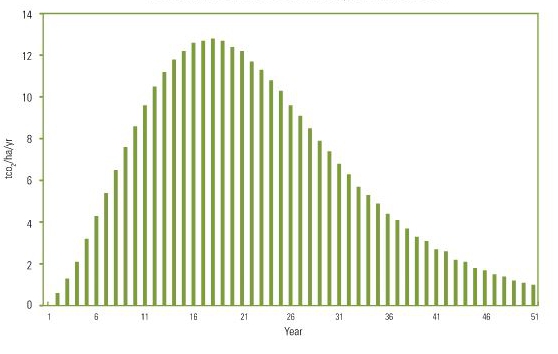
Sheep were excluded from both ends of the island in around 1996, and the 20 Ha of shrublands and developing forests could therefore be said to be at Year 23, sequestering 11 tonnes CO2 per hectare, falling to a bit over 3 tonnes per hectare in 15 years’ time.
We removed the sheep entirely about 6 years ago, and if the 17 Ha of regenerating pasturelands are therefore said to be at Year 6, they are currently sequestering about 4 tonnes per hectare.
So, for the current year, CO2 is probably being sequestered in the newer forests and regenerating pasture at about 288 tonnes CO2-e per year. In 15 years, say when the need for active intervention in the restoration, and associated CO2-e emissions, is much less, offsetting would still be around 250 tonnes per year.
I’m not sure how much of this CO2 being put away is down to the project and how much might have happened anyway. If we hadn’t become involved, the island might have remained uninhabited and the 20 sheep present in 2012 might have persisted, say for 10 more years (they had already managed 8 by themselves since 2004 when Ross Webber left). Or indeed someone might have taken it over as a lifestyle block and run 20 sheep, 15 alpacas and a pony. To a first approximation, the sheep might have had an effect equivalent to completely preventing regeneration on the 17 Ha of central pasturelands: that 17 Ha would have become populated with the unpalatable tauhinu, which stores CO2 as well as anything else, but the sheep might well have had an opposite effect on the broadleaf shrublands and developing forest (the fencing present in 1996 had been allowed to fall into disrepair by 2012, and gates had been left open, so if things had just carried on the sheep would have been in the regenerating areas more and more as the tauhinu took over the pasture). The lookup tables say that if regeneration of 17 Ha pasture were prevented by the sheep for 10 years, then a total of 40 tonnes CO2-e per hectare (680 tonnes total, or about 10 rising to 130 tonnes CO2-e per year from year 1 to 10) would not have been stored.
On top of that would be the effect of methane emissions from the sheep, of which there were about 20 in 2012 when we arrived. Methane has 25 times the long-run global warming potential of CO2 (Ref. 11). Sheep methane emissions are in the range 9-35 grams per day per sheep (Ref. 12). Let’s say the island sheep were right at the low end of that range. That still adds up to 1.6 tonnes of CO2-e per year for the time the flock persisted.
Conclusions
It’s hardly surprising that our activities are easily offset by forest regrowth, if a bit harder to say how much of the forest regrowth is incremental because of our actions, but it’s worth the exercise to set it out on paper. I wouldn’t have guessed that simply removing the sheep would have had such a benefit. So I’m somewhat reassured, even given my simplistic calculations. The value for readers might be in having a look at the references and thinking about their own situation. Millennials: do factor in the effect of having your Uber Eats delivered (Dang. Almost made it).
References (all links accessed June 2019)
- Sustainable Energy Without The Hot Air. See for example: https://commonsciencespace.com/energy-sensible-sewtha/
- https://www.mfe.govt.nz/sites/default/files/media/Climate%20Change/voluntary-greenhouse-gas-reporting-2015-year.pdf
- https://www.mfe.govt.nz/sites/default/files/media/Climate%20Change/voluntary-ghg-reporting-summary-tables-emissions-factors-2015.pdf
- https://www.airnewzealand.co.nz/loyaltymodule/form/carbon-emissions-offset
- https://www.ecta.com/resources/Documents/Best%20Practices%20Guidelines/guideline_for_measuring_and_managing_co2.pdf
- http://www.skyworkhelicopters.com/company/helicopter-fleet.cfm
- https://www.appropedia.org/LCA_of_silicon_PV_panels
- https://www.apc.com/salestools/VAVR-9KZQVW/VAVR-9KZQVW_R0_EN.pdf?sdirect=true
- https://www.carbonfarming.org.nz/wp-content/uploads/InfoSheet_13New.pdf
- https://www.carbonfarming.org.nz/wp-content/uploads/2011-ETS-look-up-tables-guide.pdf
- https://www.nzagrc.org.nz/methane-1.html
- https://www.landcareresearch.co.nz/science/greenhouse-gases/agricultural-greenhouse-gases/methane-emissions
Discover more from Fauna Recovery New Zealand
Subscribe to get the latest posts sent to your email.
